Exploring a new oncology service line
An independent hospital system in a large metropolitan area is undergoing tremendous growth and becoming a fully integrated delivery network. The ambulatory growth officer for the business development team was tasked by executives to investigate the possibility of building their own oncology program. Using data and insights from Definitive Healthcare, the team was able to analyze potential provider partners to inform an oncology service line strategy.
Key results
- Defined and refined the oncology service line strategy
- Deepened analytics with outpatient data
The challenge
The hospital’s business development team needed to understand connections between site-specific oncology diagnoses, downstream procedures, and the associated potential revenue opportunity from establishing their own oncology program for their outpatient medical group.
The main questions the team had included:
- Would they want to partner with someone?
- Would they want to acquire a practice?
- Would they want to hire their own providers?
The solution
The team’s analysis began with a closer look at a potential physician leader for the oncology program. While they could hypothesize on the diagnosis and procedure claim activity associated with a general oncologist, the team wanted to understand where a provider mainly practices from and what kind of service categories they cover.
Using all-payor claims data and visualizations in the Definitive Healthcare Provider Explorer Volume dashboard, the team gained a better understanding of the sub-service lines, the breakdown of the CPT codes that a general oncologist might bill for, and the locations associated with those claims. Most importantly, the team could analyze outpatient claims from provider practices, which they had previously been unable to access via inpatient-only data sources.
The information helped them better identify specific practitioners who were most likely to align with their growth priorities.
The impact
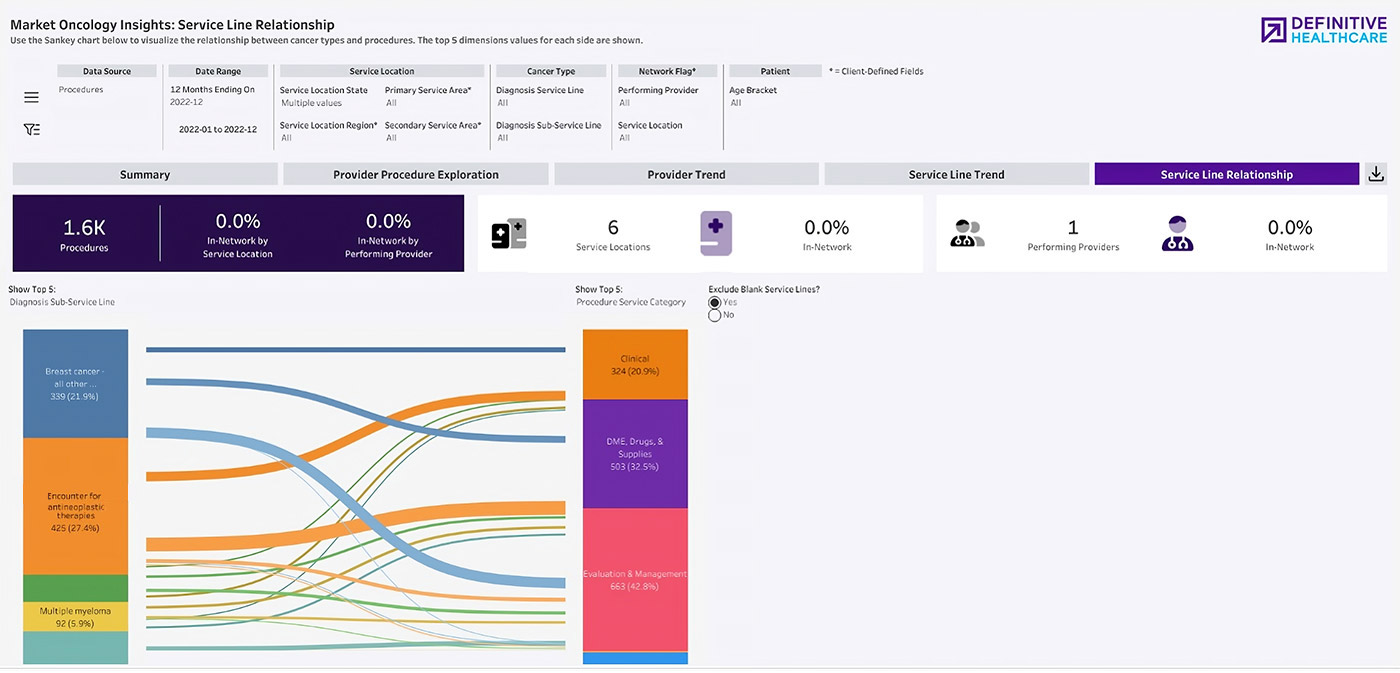
Visualizations like the Sankey Diagram below show the downstream activity a particular provider generates and informs the team on the provider’s potential fit for their organization.
The chart confirms this provider’s sub-service line of breast cancer diagnoses would support their existing breast cancer program. The data also shows the provider is a generalist and not specialized, and sees patients with diverse types of tumors. That’s a benefit for the hospital system, which wants its potential oncology services to treat many forms of cancer.
The team’s analysis and presentation to executives helped define and implement the oncology service line strategy. Their ideal cancer program leader would have strong experience as a generalist to help expand services and patient care options. The community providers who presented high partnership potential could also generate downstream opportunities in additional service lines such as chemotherapy and immunotherapy treatments, imaging, radiation oncology, and surgical oncology.