See tomorrow's healthcare market, today
Market Forecast provides healthcare provider organizations with dynamic market analytics to strengthen the strategic planning process. Built from projected U.S. census metrics and our robust claims dataset, interactive analytics and data visualizations deliver high-resolution, iterative insights into potential market dynamics impacting the forecasting model. Model market conditions three, five, or even 10 years into the future to craft and implement forward-thinking growth strategies.

Key forecast data
Real data. Real results.
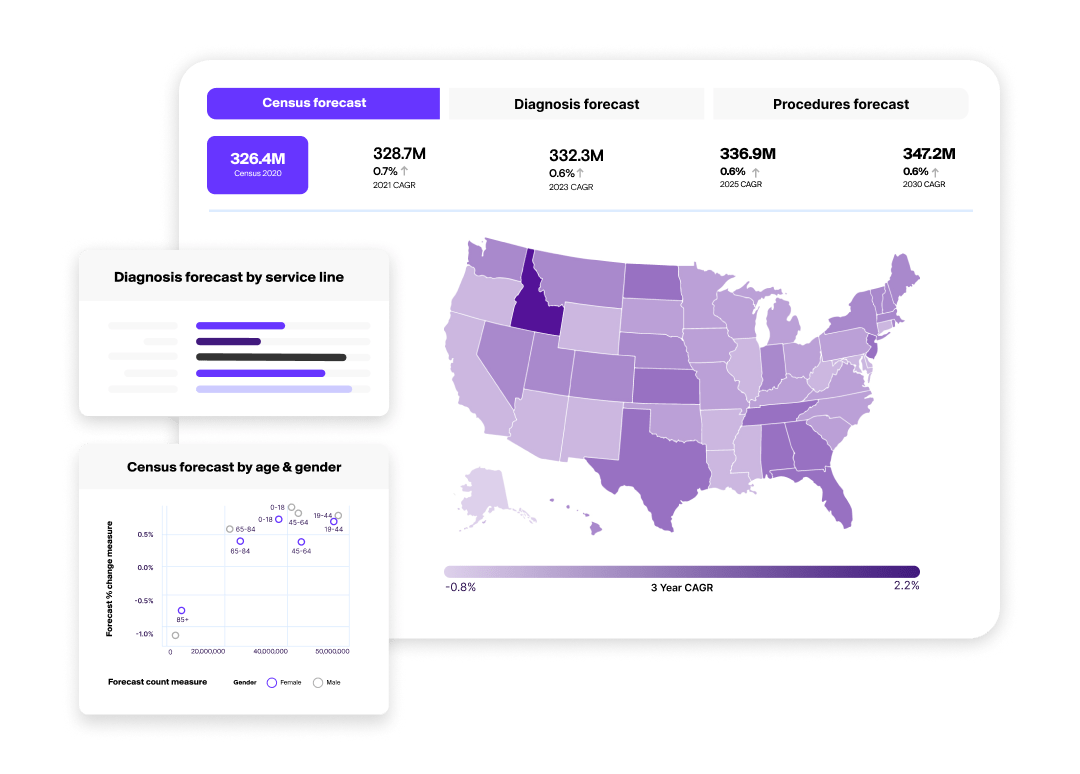
Census forecast
View projected U.S. Census forecast data paired with historical all-payor claims to create patient and population trends.
Procedure forecast
Pinpoint potential high-growth or high-volume procedures by category, sub-category, or service line.
Diagnosis forecast
Visualize service line and disease category predictions with the diagnosis 9-Blocker graph and the ability to apply different incident rate constants.
Look ahead to drive results
Dynamic market analysis
Use intuitive self-service analytics to dynamically assess projected volumes at both macro and granular levels, as well as from various perspectives, including geography, procedures, diagnoses, providers, and more.
Get startedAnalytics for growth-focused teams
Equip your entire organization with the data and analytics it needs for its strategic initiatives.
Get started
Multiple access options
Access Market Forecast from our front-end platform or your own systems via APIs and direct data integration. Our self-service platform provides pre-built dashboards and customizable data visualizations, which can be used as is, or downloaded as templates.
Get startedSee our data
Access unique insights.
Focus on what really matters
See how top provider organizations use Market Forecast to strategically plan.

Market planning and assessment
Understand trends across populations, service lines, and geographies to forecast opportunities and plan for growth.

Consumer and provider demand
Identify service lines and procedures in your market with the highest amount of clinical volume along with a high projected growth rate.

Scenario planning
Analyze how different inputs and filters can change projections from a geographical, patient demographic, diagnosis, or procedure perspective.
Recognized for comprehensive, intuitive, and accurate insights.
We’re proud to deliver healthcare intelligence that users love.
Move ahead with confidence
Market Forecast helps you:
Increase net revenues
Identify service lines and procedures with the highest amount of clinical volume or high projected increases to focus growth opportunities.
Expand market presence
Pinpoint where new or expanded services are in demand and direct investments around expected types of patients or procedures.
Allocate resources
Analyze how various impact factors and filters can change projections from multiple perspectives with refined analyses of numerous scenarios and inputs.
Expand your view
Our additional solution bundles for providers can help you increase revenue and broaden your market presence.
Market Intelligence
Size markets, assess the competitive landscape, and direct investments with data-based market analysis.
Network Intelligence
Manage network performance with analytics on referral patterns, benchmarks, and market volumes.
Population Intelligence
Optimize your marketing campaigns and consumer activation with robust patient and consumer analytics.
Provider Intelligence
Inform your provider outreach and targeting strategy with comprehensive affiliations and attribute data.
Frequently asked questions
Market forecasts and projects are derived from historical medical claims data including diagnosis claims and procedure claims, as well as projected U.S. census population data we obtain from a third party.
Our tools allow for setting difference reference years, going back to 2018 and through 2023.
Forecast analysis and data display in time intervals of 1, 3, 5, and 10 years in the dashboards or year-over-year intervals (up to 10 years) in direct data access to the product tables.
The percentage change measure shows the absolute change in value over a specific period. This can be useful for seeing the most direct review of the data from a short-term, straightforward performance evaluation perspective.
The compound annual growth rate (CAGR) measure is often used in financial-based analyses to “smooth out” the impact of compound growth over time. It is ideal for long-term growth planning as it accounts for the compounding effect, giving a more accurate picture of growth over multiple years.
Census trends can by viewed by state, county, CBSA, MSA, Zip3, Zip-5, age bracket, and gender
The 9-blocker is a powerful visual tool for comparing two metrics across a single dimension. In our visualizations, we compare a diagnosis or procedure count and CAGR/percentage change across service scopes, service lines, or sub-service lines.