How to use claims and reference data to support your provider staffing strategy
It’s a tough time for staffing in the provider market. Due to provider burnout and increased demand, there are more jobs than candidates. If you’re staffing in an especially saturated market, winning or losing a candidate can come down to a matter of minutes.
Fortunately, there are still ways to gain a competitive advantage. You don’t need to market in your territory blind, and you don’t need to cast an impossibly wide net to find top candidates. By asking the right questions with the right data, you can find the candidates best suited for the roles your clients need filled.
In this guide, we’ll examine how to use healthcare commercial intelligence from multiple sources to support your provider staffing strategy, so you can find and engage the right candidates more effectively. After reading this guide, you should understand how to use a variety of data sources—including claims and reference data, primary research, and news and intelligence—to develop a customized list of facilities and candidates who are ready for staffing opportunities in your market.
Use the right information
Over 333,000 healthcare workers—or about 1 in 5 industry professionals—left their jobs in 2021. In response to this massive exodus, many providers are now weighing how (and how much) to invest in building back.
Whether you’re involved in long-term healthcare staffing or locum tenens placements, you need to know which providers are putting the most resources toward hiring the type of candidates your organization works with. Using a variety of real-time data sources can help you uncover these details and better understand your market.
- Primary research can help you find self-identified job seekers on resume sites and hospitals or surgery centers within your geography.
- Healthcare reference and affiliations data can provide detailed intelligence about the relationships and connections between providers and organizations, like who works at which hospital, which ACO owns which facility, or which billing office manages which physician group.
- Claims data offers insights into physician behavior, revealing diagnosis, procedure, and prescribing activity at the provider and organizational levels.
Individually, these sources only deliver a limited view of your target market. To get a useful cross section, you’ll need to layer primary research with reference and claims data. Analyzed together, this commercial intelligence can help you determine which facilities need your services, which facilities can afford your services today, and which candidates are best suited for the available roles.
For instance, starting with claims data, you can use the national provider identifiers (NPIs) of healthcare professionals (HCPs) and determine the number of patients each HCP sees per month. From there, you can identify which HCPs are seeing significantly more patients than average.
But analyzing claims data based on NPI alone can be misleading. There are over 6 million NPIs nationwide, and most facilities are connected to a multitude of NPIs. For example, Mt. Sinai has over 200 organizational NPIs. Pairing claims with reference data enables you to map those NPIs to the right facility.
Using reference and affiliations data to properly map provider NPIs to facilities, you can find the facilities with the most overworked physicians—and thus the greatest need for additional staff. This data can also help you understand network hierarchies, track financial and quality performance, and identify important relationships like staffing managers within specific service lines, vendor partnerships, technology contracts, and more.
With additional research, you can go even further, using claims data to contextualize patient load by specialty or service line. By identifying locum tenens professionals based on affiliation, you can see how a facility leverages contracted labor. You might also look into news and business intelligence sources to spot recent expansion efforts, leadership changes, or partnerships that may have an impact on budget and hiring practices.
Target organizations based on need
Equipped with a variety of data sources, you should be able to develop a sharper picture of the market with a focus on facility or organizational bandwidth. Now, let’s dig deeper into claims data to understand physician behavior and what’s really happening within those facilities.
Once you have a list of potential facilities and all their affiliated NPIs, count the number of distinct physicians billing for those facilities within a specific time frame (2019 – 2021, for instance). Break that number down further by physicians who left in that period and those who were hired in that period.
Then, calculate the rehire ratio: divide the lost physicians by the gained physicians. If the resulting score is above 1, the facility has lost HCPs, while a score below 1 indicates a gain.
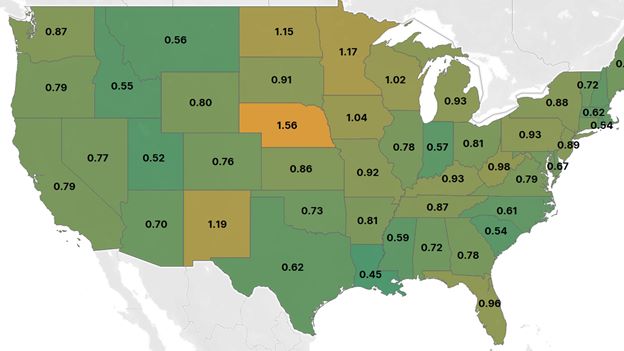
Fig. 1 Claims data analysis revealing rehire ratio for U.S. states, 2019 – 2021.
With your target facilities’ hiring trends quantified, compare those ratios to larger gain/loss trends within a region or specialty. You might examine how facilities compare with their state’s overall performance (as in Fig. 1) or zoom out to the CBSA level. You can use these insights to prioritize organizations with outsized HCP losses or to target specialties with high attrition and low med school matriculation rates.
Remember: Rehire ratios represent a snapshot in time. To understand how your market is trending, try plotting rehire ratios across several periods.
Home in on specialties with an aging problem
An aging population is leading to surging demand for specialized physicians, but the physician workforce itself is aging, too. Across top specialties, the average physician is in their fifties. A third of all physicians are over 59 years old, and about 40% of active physicians are projected to be age 65 or older within the next decade.
Physician age data derived from reference data (like Physician Compare and the NPI Registry) and medical school graduation information can be layered with claims data, enabling you to analyze your targeted facilities or health systems and find those with the greatest percentage of doctors nearing retirement age. The same method works at a geographic and specialty level.
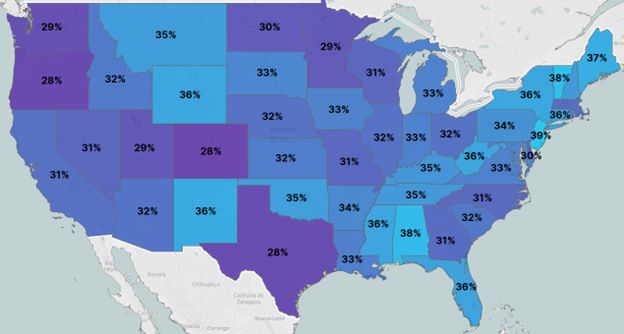
Fig. 2 Analysis of physicians aged 60+ by U.S. state using Physician Compare, NPI Registry, and American Board of Medical Specialties data for 2021.
Comparing the prevalence of certain specialties by region with age information can help you find higher-level opportunities, too. For instance, claims data shows that allergy and immunology specialists are among the top three most common specialists in the Northeast, and more than half of them are over 60. If your organization is focused on placing allergists and immunologists, the Northeast would be a great place to start looking.
Not only does this detailed commercial intelligence help you find facilities that need your services; it also helps you position your organization as a strategic partner rather than a member of a simply transactional relationship. With an understanding of the aging trends at a particular facility, you can both provide candidates tailored to the facility’s needs and serve as a resource for their strategic planning.
Prioritize locum tenens providers
Locum tenens providers are in high demand, and your staffing organization is probably constantly seeking new candidates—but not all eligible candidates self-report as locum tenens. So how do you find those who aren’t advertising their services?
You can identify locum tenens providers using a three-step process that transforms behavioral claims data and affiliations determined via reference data into healthcare commercial intelligence:
- Evaluate the provider’s affiliations
- Identify multiple sites of care
- Check for modifiers on claims
The process is simple: Use claims and reference data to establish the average number of affiliations in a targeted specialty, then identify the providers who have more affiliations than average. This doesn’t definitively mark an HCP as locum tenens, but it’ll give you a good list of candidates to drill deeper into.
Next, pull out the providers who have billed through multiple concurrent billing office NPIs in the last two years.
Finally, look for providers using the Q6 modifier on their claims. This practice varies by payor and state, but it often indicates locum tenens status.
Going further, you can combine provider-level insights with geographic insights to determine regions, states, and cities with a disproportionate reliance on locum tenens providers. This tactic can be used to identify potential candidate sources or targets for staffing.
By comparing your list of providers with the facilities where they work, you can find the hospitals employing the most locum tenens providers and even pinpoint the departments—and department heads—doing the hiring.
Be sure to target the right candidates at the right time. Not every provider on your list is right for every opening, even if they have the right qualifications on paper.
Consider the average age and workloads of permanent versus locum tenens positions: Locum tenens providers tend to skew younger and work twice as many shifts as permanently employed providers, on average. As you’re finalizing your list of potential candidates, you might find matches faster by focusing on those who are younger and demonstrate higher workloads than their peers.
What it all means
Healthcare commercial intelligence built on claims and reference data can deliver incredibly useful insights to organizations and teams looking to staff the most qualified candidates quickly. By leveraging this data—and a little primary research—you can target organizations by provider bandwidth, identify specialties and regions with unique needs, and find potential candidates who may not be self-reporting as open to locum tenens work.
For more information on developing data-driven staffing strategies, check out these resources:
- Watch our on-demand webinar covering the usage of claims and reference data to address staffing questions
- Read our blog on why hospitals continue to cut jobs amid the staffing shortage
- Check out our report on the factors behind the staffing shortage
Ready to see how healthcare commercial intelligence can support your staffing strategy? Book a demo with our team of experts today.