Leveraging market analytics has proven to be a key strategy for companies planning to map sales territories and target ideal sales prospects.
Pharmaceutical and medical device companies might, for instance, use diagnosis and procedure volumes to gain vital insights into the needs of individual hospitals and care facilities. Staffing and recruiting agencies, on the other hand, rely more heavily on HCAHPS patient satisfaction scores as the first indicators of physician shortages.
What is a CBSA?
Core Based Statistical Areas (CBSAs) were introduced by the Office of Management and Budget in 2003. A CBSA is a metropolitan or micropolitan area with a population of at least 10,000 people. This is often a city and its surrounding suburbs, like CBSA 26420 —which encompasses Houston, the Woodlands, and Sugar Land, TX.
Definitive Healthcare’s HospitalView database tracks over 960 CBSA profiles. Each CBSA profile contains key statistics about:
- Estimated Population
- Population Growth (from the previous year)
- Total Number of Facility Types
- Net Patient Revenue
- Number of Total Beds
- Demographic breakdowns
Healthcare organizations can use this information to gain valuable population insights such as tracking areas with the highest estimated population growth. The table below shows the five largest CBSAs based on the estimated 2022 population.
Largest CBSAs by estimated population
| Rank | CBSA code | CBSA name | Est. population |
| 1 | 35620 | New York-Newark-Jersey City NY-NJ-PA | 19,617,868 |
| 2 | 31080 | Los Angeles-Long Beach-Anaheim CA | 12,872,322 |
| 3 | 16980 | Chicago-Naperville-Elgin IL-IN-WI | 9,441,957 |
| 4 | 19100 | Dallas-Fort Worth-Arlington TX | 7,943,685 |
| 5 | 26420 | Houston-The Woodlands-Sugar Land TX | 7,340,118 |
Fig. 1. Data is from the Definitive Healthcare HospitalView product. CBSA population data is sourced from the U.S. Census Bureau with statistics updated within Definitive Healthcare’s product suite annually. Accessed December 2023.
For the purposes of healthcare market analytics, we’ve aggregated numerous data points by CBSA to allow for market analysis between states and cities at this intermediate level. Here are three ways leveraging CBSA information can be most useful for your business.
Analyze claims data
When gauging the market for applications of a specific pharmaceutical or medical device, understanding the volume of diagnoses and procedures performed in a given area can be essential to finding sales opportunities—including competitor displacement.
For example, if a medical device manufacturer sells a device that is used in a specific procedure, and they are trying to figure out where they should build up their sales force, they can review how many relevant procedures are performed by CBSA. This offers more specific insight than state-wide analysis without making sales directors do the work of piecing together the cities and towns performing high volumes of said procedure.
A medical device company selling stents would leverage claims information to find where the greatest volume of angioplasties is being performed. The facilities reporting the most angioplasty procedures may be looking for new stent solutions, offering the chance of competitor displacement. Additionally, vendors can analyze accompanying quality metrics—like 30-day readmission rates or hospital-acquired condition (HAC) scores—to cater to their messaging and device solutions.
The table below shows potential opportunities in CBSA 35620 (New York-Newark-Jersey City NY-NJ-PA) based on diagnoses codes.
Top inpatient diagnoses for CBSA 35620 by volume
| Rank | ICD-10 code | ICD-10 description | Percentage of total diagnoses |
| 1 | I10 | Essential (primary) hypertension | 3.0% |
| 2 | N179 | Acute kidney failure, unspecified | 1.8% |
| 3 | E785 | Hyperlipidemia, unspecified | 1.5% |
| 4 | I2510 | Atherosclerotic heart disease of the native coronary artery without angina pectoris | 1.1% |
| 5 | E119 | Type 2 diabetes mellitus without complications | 1.0% |
Fig 2 Inpatient diagnosis volumes for CBSA 35620 are from Definitive Healthcare’s Atlas All-Payor Claims product for the calendar year 2023 through November. Claims data is sourced from multiple medical claims clearinghouses in the United States and updated monthly. Accessed December 2023.
Examine provider density
Another way of conducting market analysis is by looking at clinician density. A CBSA with low provider density may mean that the area is facing a staffing shortage and would make an ideal target for staffing and recruiting agencies looking to place locum tenens or full-time providers. The facilities in this area may also be receptive to telehealth solutions that would connect their patients with specialists not physically working in their region.
The number of hospitals and group purchasing organizations (GPOs) can also influence the value of a particular CBSA. More hospitals mean more opportunities—particularly if a vendor can work with an entire health system or GPO.
The patient population per hospital or per bed may also be of interest to people selling to the healthcare industry. High rates of bed usage could mean that a hospital needs more clinicians or is ready to expand. Low rates of bed usage could indicate a hospital is in an area with high competition, or that the patient population does not have proper access to care. Some of this data is shown for the top 5 CBSAs below.
Provider density for the 5 largest CBSAs
| Rank | CBSA code | CBSA name | Est. population | Number of GPOs/RPCs | Number of hospitals | Avg. population per hospital |
| 1 | 35620 | New York-Newark-Jersey City NY-NJ-PA | 19,617,868 | 19 | 228 | 86,043 |
| 2 | 31080 | Los Angeles-Long Beach-Anaheim CA | 12,872,322 | 18 | 153 | 84,132 |
| 3 | 16980 | Chicago-Naperville-Elgin IL-IN-WI | 9,441,957 | 18 | 140 | 67,442 |
| 4 | 19100 | Dallas-Fort Worth-Arlington TX | 7,943,685 | 21 | 173 | 45,917 |
| 5 | 26420 | Houston-The Woodlands-Sugar Land TX | 7,340,118 | 19 | 142 | 51,690 |
Fig 3 CBSA market overview data from Definitive Healthcare’s HospitalView product. “Average population per hospital” metric is calculated by dividing the CBSA population by the total number of hospitals. The estimated patient population is from 2022 census data, the most recent available. Accessed December 2023.
Review technology utilization
Definitive Healthcare also synthesizes technology usage by CBSA, which can be used to recognize regional preferences for certain technologies. In the New York-Newark-Jersey City CBSA, for example, Epic leads the market for inpatient EHR software, with nearly six times the market share of MEDITECH.
Technology implementations and market share information can highlight opportunities for vendors and help them understand the competitive landscape.
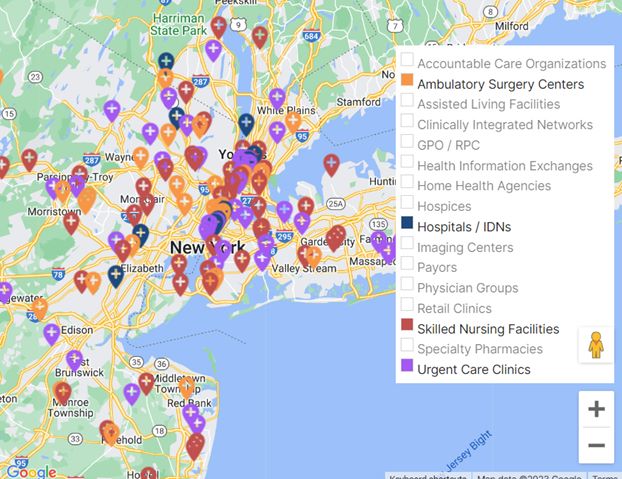
Fig 4 A map showing the locations of hospitals, IDNs, ASCs, SNFs, and urgent care clinics operating in CBSA 35620, New York-Newark-Jersey City NY-NJ-PA. Screenshot taken from the CBSA market overview in Definitive Healthcare’s HospitalView product
By analyzing markets based on CBSA codes, there are a number of ways to dig into key information that can maximize your chances of success when selling into or working with the healthcare industry.
Learn more
For more information on how to effectively target your market and increase your profits, sign up for a free trial of Definitive Healthcare’s comprehensive product suite. The HospitalView product tracks daily updates on more than 8,300 hospitals and health systems across the U.S.

You might also be interested in...